BigQuery PPC and SQL
A Google Merchandise analysis with SQL
In this project, I used BigQuery data "bigquery-public-data.google_analytics_sample.ga_sessions" containing session-level data from the Google Merchandise Store, which includes information on user interactions with the website. To demonstrate my SQL skills in BigQuery on PPC reports integrated with important Marketing metrics, such as Customer Lifetime Value (CLV).
The full code can be found on GitHub but in this post here I display 2 important pieces of code, the first Traffic Sources and the Customer Lifetime Value (CLV) Calculation.
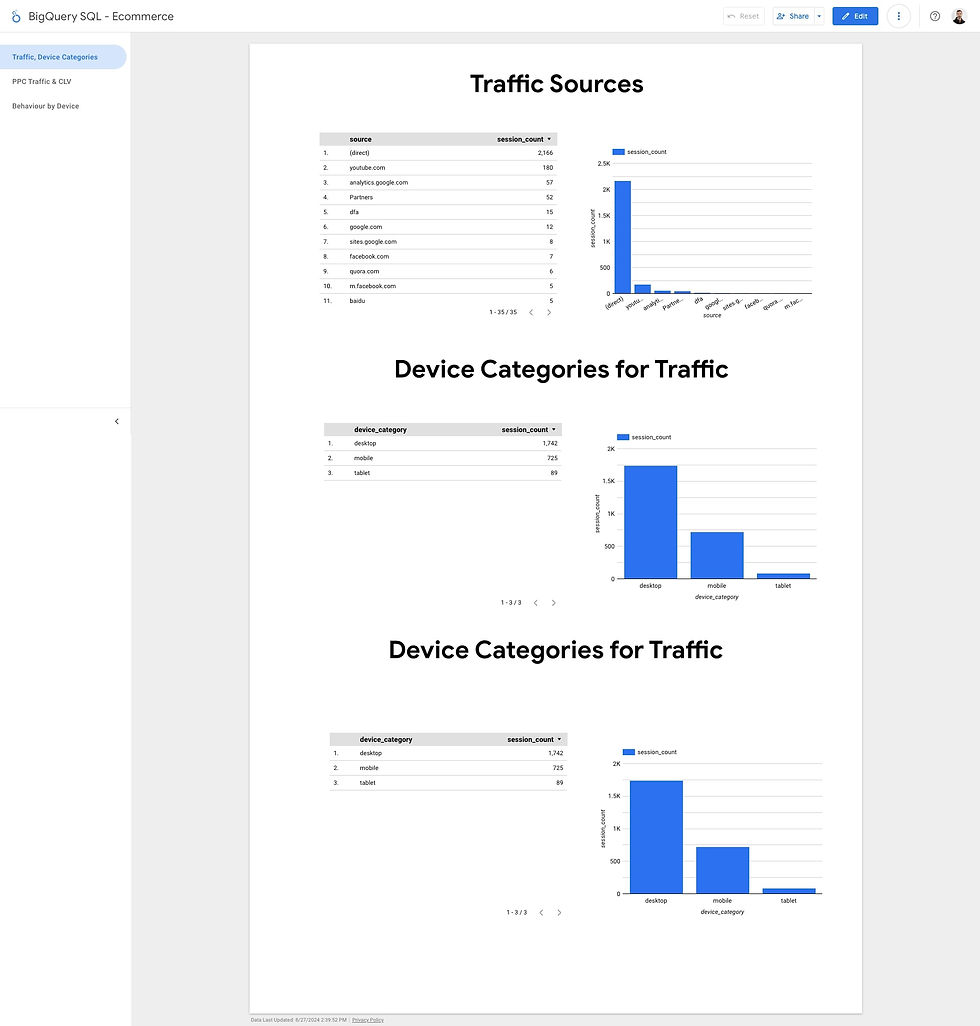
Link to Looked report for graph display images.
Traffic Sources: Identifying the distribution of traffic sources for sessions on the specified date.
SELECT
  trafficSource.source AS source,
  trafficSource.medium AS medium,
  COUNT(*) AS session_count
FROM
  `bigquery-public-data.google_analytics_sample.ga_sessions_20170801`
GROUP BY
  source, medium
ORDER BY
  session_count DESC
LIMIT 100;
Analyze Device Categories for Traffic: Providing insights into which devices were most commonly used by users who came via campaigns.
User Location Analysis for PPC Traffic: Analyzes the geographic distribution of users who came via PPC campaigns.
Customer Lifetime Value (CLV) Calculation: This query estimates the customer lifetime value by calculating the total revenue generated by a visitor across multiple sessions:
WITH
  customer_revenue AS (
    SELECT
      fullVisitorId,
      SUM(totals.totalTransactionRevenue) / 1e6 AS total_revenue_usd
    FROM
      `bigquery-public-data.google_analytics_sample.ga_sessions_20170801`
    GROUP BY
      fullVisitorId
  )
Day of Week and Hour of Day Analysis for PPC Traffic: This query analyzes when PPC traffic is most active by looking at the day of the week and hour of the day.
Traffic Sources Analysis: This query identifies the top sources driving traffic to your site, which can help understand where your marketing efforts are most effective.
Behaviour by Device Category: This query reveals how different devices contribute to sessions, which is crucial for optimizing marketing campaigns across platforms.
User Engagement by Hour: This query helps understand when users are most active, which can inform the timing of your marketing activities.
New vs. Returning Visitors: This query differentiates between new and returning visitors, helping to evaluate the effectiveness of retention strategies. Used condition - if(condition, if true, if false)


