BigQuery PPC
A Google Merchandise analysis with SQL
In this project, I used BigQuery data "bigquery-public-data.google_analytics_sample.ga_sessions" containing session-level data from the Google Merchandise Store, which includes information on user interactions with the website. To demonstrate my SQL skills in BigQuery on PPC reports and E-commerce, I integrated this report with important Marketing metrics, such as Customer Lifetime Value (CLV).
The full code can be found on GitHub but in this post here I display 2 important pieces of code, the first Traffic Sources and the Customer Lifetime Value (CLV) Calculation.
Data Source: BigQuery Sandbox
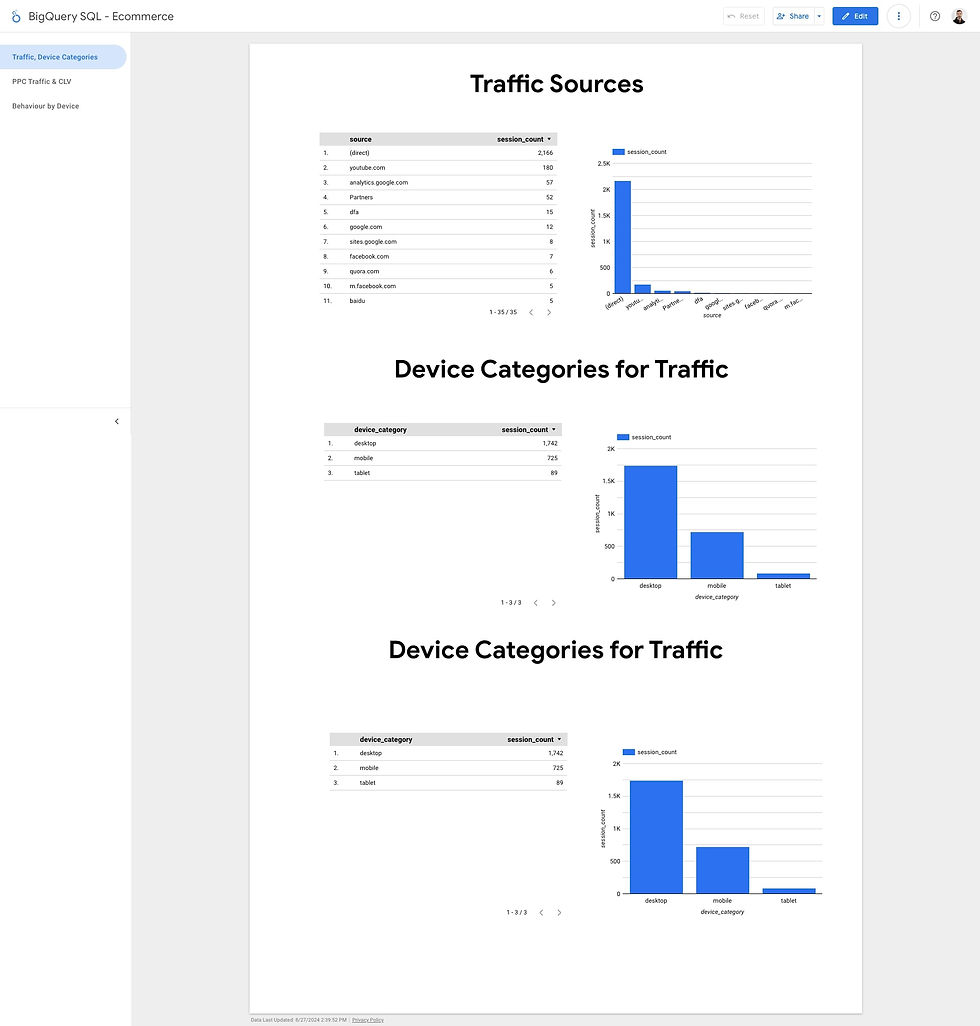
Link to Looker report for graph display images.
Metrics Analysed:
Traffic Sources: Identifying the distribution of traffic sources for sessions on the specified date.
SELECT
  trafficSource.source AS source,
  trafficSource.medium AS medium,
  COUNT(*) AS session_count
FROM
  `bigquery-public-data.google_analytics_sample.ga_sessions_20170801`
GROUP BY
  source, medium
ORDER BY
  session_count DESC
LIMIT 100;
Analyze Device Categories for Traffic: Providing insights into which devices were most commonly used by users who came via campaigns.
User Location Analysis for PPC Traffic: Analyzes the geographic distribution of users who came via PPC campaigns.
Customer Lifetime Value (CLV) Calculation: This query estimates the customer lifetime value by calculating the total revenue generated by a visitor across multiple sessions:
WITH
  customer_revenue AS (
    SELECT
      fullVisitorId,
      SUM(totals.totalTransactionRevenue) / 1e6 AS total_revenue_usd
    FROM
      `bigquery-public-data.google_analytics_sample.ga_sessions_20170801`
    GROUP BY
      fullVisitorId
  )
Day of Week and Hour of Day Analysis for PPC Traffic: This query analyzes when PPC traffic is most active by looking at the day of the week and hour of the day.
Traffic Sources Analysis: This query identifies the top sources driving traffic to your site, which can help understand where your marketing efforts are most effective.
Behaviour by Device Category: This query reveals how different devices contribute to sessions, which is crucial for optimizing marketing campaigns across platforms.
User Engagement by Hour: This query helps understand when users are most active, which can inform the timing of your marketing activities.
New vs. Returning Visitors: This query differentiates between new and returning visitors, helping to evaluate the effectiveness of retention strategies. Used condition - if(condition, if true, if false)
Project Gallery


